Lab Report
Name: Edgar A. Azuara Date: 10/22/2025
Course: ENG 21007 Instructor: Mr.Bubrow
Title: Rolling the Odds:
Exploring Probability Through Dice Rolls
This experiment focuses on understanding how probability works through a simple dice-rolling test. The goal is to figure out which numbers appear most often when two dice are rolled 100 times. The experiment tests the idea that the middle numbers between 2 and 12 will be the most common outcomes. By keeping track of each roll and analyzing the results, we can see how probability plays out in real data and if the expected outcomes match reality.
Layout of Experiment:
This experiment explores the concept of probability by using 2 dice to show how certain outcomes can appear more often than others. Probability helps explain how likely something is to happen, and rolling dice is an easy way to see the results in front of us. The purpose of this experiment is to figure out probability and how it works in real situations. Dice are used because they have results that make it easier to understand patterns. The experiment helps show why some outcomes happen more frequently and what that means in terms of probability.
Hypothesis:
In this experiment the most popular numbers will be the median numbers from 2–12 when two dice are rolled 100 times because the number in the middle/median of a range from the minimum, which in this experiment is 2 and the maximum being 12, will be the most common numbers.
Materials and Method
- Two dice
- Paper or digital spreadsheet for recording results
- Pen or pencil
- Calculator
Steps:
- Gather two dice and clear a flat surface.
- Roll both dice together 100 times.
- Record the total number shown after each roll.
- Keep track of how many times each number from 2 to 12 appears.
- Organize the data to prepare for graphing and analysis.
What I found from rolling the dice 100 times was the biggest sum that I got from both dice was numbers in between of 2 and 12
My results:
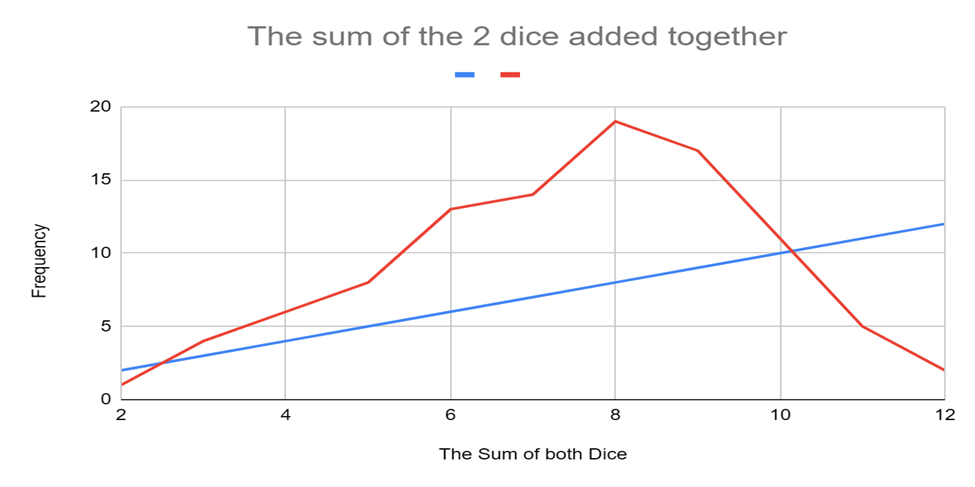
Figure 1: These were the results of what I got when I rolled both dice 100 times
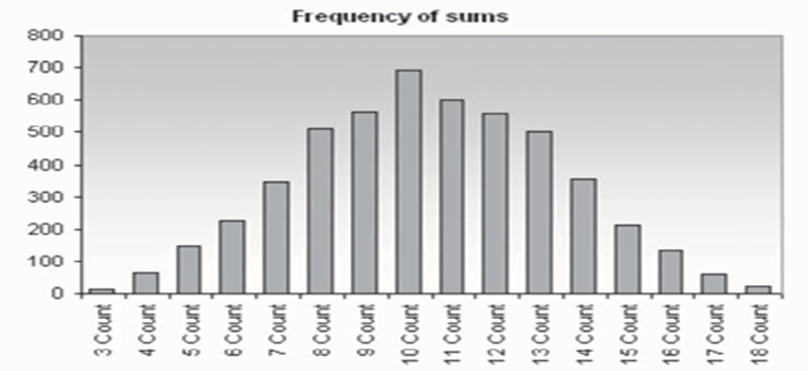
Figure 2: It’s the experiment I found from Lukáč rolling 3 dice way more times
Results:
Looking at the experiment I have made, I can see that my hypothesis was very close to the results that are shown. When I made the hypothesis I said the sum of both dice being rolled will mostly show results in the median of 2 – 12. The reason those are the numbers I would assume would be in this experiment is because the lowest number you can get with two dice is 2 and the highest is 12. The thought of my hypothesis was that because in usual math problems, the median usually is the most common, I thought the same theory would apply to rolling two dice, and it did. Some further studies that could be made is the actual pairing and seeing how common it would be to see both dice be rolled and which combinations will be seen the most, whether its two dice pairing 1 and 6 or a two dice pairing 2 and 4. With the information we gave we can infer the middle/median of any number will always be the most common when it comes to probability of something.
Now compared to the experiment I got online who also did a Dice rolling summary with three dice though and way more times then I did, you can see they still got very similar results from figure 2. Figure 1 shows that the highest amount of Sum that I got was always in the Middle and never on the Max or Min. In figure 2, the most amount they got in sums too was ALSO in the median. The range they had was 3 as the minimum and 18 as the maximum, in the graph number 10 was selected the most from those three dice and is also in the middle between 3 and 18 .
Conclusion
The way of the future shows that my hypothesis on there being more sum’s being close to the median of 2-12 was accurate and the other study that used 3 dice in the reference sheet below, they tested more then I did but they still got relatively the same. With the information that was given from the experiment, you can see that the hypothesis is very close to the actual results that was given. Lastly, one study that could be made because of this experiment is to test what combinations are the most common pair. It would be interesting to see if certain dice pairings appear more than others, such as both dice landing on a 3 and 4 together, or a 5 and 4 pairing. Future experiments could also look into how the number of dice affects the pattern of results or if different shapes of dice (like 10-sided or 20-sided) change how probability behaves.
References:
Lukáč, S., & Engel, R. (2010). Investigation of probability distributions using dice rolling simulation. Australian Mathematics Teacher, 66(2), 30–35.
Edgar’s Spreadsheet for Sums on Dice, Spreadsheet used to keep data on Figure 1.